Geopolitical Escalation Breaks the Safe-Haven Myth: $1.84B in Crypto Liquidations as Rubio Threatens Hormuz Mining
The second Hormuz shock in six days wiped out $1.84 billion in leveraged bullish bets, accelerating a structural thesis that bitcoin is now a high-beta risk asset — not a hedge — as global equities hit all-time highs.
Executive Summary
$1.84 billion in leveraged positions liquidated in 24 hours ending June 3, 2026 — the largest single-day wipeout since February 5 — with long positions absorbing 90% of losses ($1.66B) while BTC fell below $66,000 and ETH collapsed under $1,900
Secretary of State Marco Rubio escalated rhetoric beyond the May 28 airstrikes by threatening to mine the Strait of Hormuz, removing ceasefire optimism that had partially stabilized markets and triggering a fresh risk-off cascade
Bitcoin diverged sharply from traditional risk assets for the second consecutive week: the MSCI All Country World Index logged a fresh all-time high on AI-driven equity strength the same day BTC posted a 12.3% weekly loss — empirically dismantling the "digital gold / safe-haven" narrative
BTC-Nasdaq correlation has surged to 0.75 while BTC-Gold correlation has turned negative (-0.27), and bitcoin has now fallen to the 13th largest global asset by market cap ($1.5T), overtaken by AI semiconductor stocks and precious metals
The 66% prediction-market probability of sub-$55,000 bitcoin by year-end signals that the structural bear case is becoming consensus; the critical 30-day catalyst is whether Hormuz shipping disruptions materialize into sustained oil price shocks that would further accelerate capital flight from risk assets
Background & Market Context
Our May 9 report documented the first wave of crypto market damage linked to the resumption of US-Iran hostilities, when initial airstrikes triggered roughly $500–900 million in leveraged long liquidations and pushed bitcoin toward $73,000. At that stage, the dominant analytical frame remained "temporary risk-off shock in a broadly bullish cycle" — a speed bump, not a paradigm shift. The thesis was that crypto's correlation to geopolitical events was episodic rather than structural, and that once diplomatic signals stabilized, the bull market would resume.
That thesis has now been invalidated across multiple data dimensions. In the five weeks between the May 9 report and June 3, a second and third shock wave hit markets in rapid succession: US forces struck Iranian air-defense radar installations and drone sites near the Strait of Hormuz on May 28 (triggering a $958.8 million liquidation cascade), Iran's Islamic Revolutionary Guard Corps retaliated on June 1 with missile and drone strikes targeting the Ali Al Salem airbase in Kuwait, and then Secretary of State Marco Rubio escalated rhetoric to an entirely new level by threatening to mine the Strait of Hormuz itself — not merely conduct defensive strikes, but actively blockade one of the world's most critical energy chokepoints. Roughly 20% of global oil supply transits the Strait daily, and the threat of sustained disruption to that flow has reset the macro baseline from "geopolitical volatility" to "structural energy supply shock," a fundamentally different risk environment for crypto markets.
The macro backdrop that amplifies this geopolitical shock is the sharpest divergence between crypto and traditional assets since the 2018-2019 bear market. Global equities, led by AI semiconductor stocks, have posted fresh records in 2026: the MSCI All Country World Index hit a new all-time high on the same trading session that bitcoin posted its largest weekly loss of the year. Gold reached a record high of approximately $5,600 per troy ounce before settling near $4,486, while silver surged to as high as $120 per ounce. Capital that once bifurcated between tech stocks and crypto is now rotating clearly and measurably into AI equities and precious metals simultaneously — with bitcoin positioned on the wrong side of both trades. US spot bitcoin ETFs have recorded a 10-session, $2.97 billion net outflow streak — the longest on record — including a $1.67 billion weekly withdrawal in the first week of June. This is not retail panic; these are institutional allocation shifts.
The structural problem underlying the market mechanics is the correlation breakdown. In prior cycles, bitcoin's appeal to institutional capital rested on two parallel narratives: uncorrelated alpha in calm markets, and safe-haven properties during geopolitical stress. The 2026 data has falsified both simultaneously. BTC's 0.75 correlation with the Nasdaq means it behaves as a high-beta tech proxy during risk-off sell-offs, while its -0.27 correlation with gold means it fails to capture flight-to-safety inflows. Bitcoin has, in effect, been left in the worst of all possible worlds: it underperforms tech stocks in bull markets (because AI equities carry stronger earnings narratives) and underperforms gold in crisis markets. That double failure is what is mechanically driving the capital rotation now visible in ETF flows, derivatives positioning, and on-chain data.
Key Developments
May 9, 2026 — Initial Escalation (Prior Report Baseline): US forces conduct preliminary airstrikes on Iranian missile infrastructure. Crypto markets shed approximately $500–900 million in liquidated long positions; bitcoin retreats from $80,000+ territory toward $73,000. Initial consensus frames this as a temporary shock; leveraged longs begin rebuilding within 48 hours as ceasefire signals emerge. This optimism sets up the catastrophic positioning visible in the June 3 data.
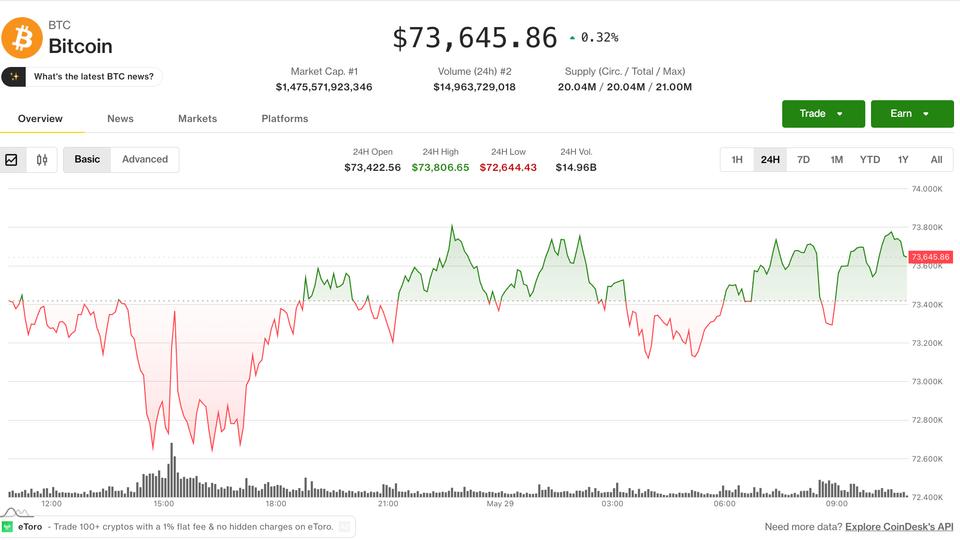
May 27–28, 2026 — US Strikes Drone Sites and Air Defenses Near Hormuz: US Central Command executes precision strikes on Iranian air-defense radar stations and drone launch sites in the vicinity of the Strait of Hormuz. Simultaneously, the US Treasury imposes new sanctions on Iran's Persian Gulf Strait Authority, explicitly targeting the body that oversees maritime transit. Bitcoin breaks below $73,000 on the news, triggering $958.8 million in total liquidations across 167,706 traders — 93% of losses hitting long positions. The largest single wipeout: a $15.34 million BTC long position closed on Hyperliquid. ETH loses the psychologically critical $2,000 level, falling to $1,976.
June 1, 2026 — IRGC Retaliates; Kuwait Airbase Targeted: Iran's Islamic Revolutionary Guard Corps launches a coordinated missile-and-drone response targeting the Ali Al Salem airbase in Kuwait, a key US forward operating facility. Kuwait reports successful intercepts, but the exchange establishes a new normal: the conflict has graduated from unilateral US strikes to bilateral military exchange. Bitcoin, which had partially recovered to the $69,000–70,000 range over the preceding days, immediately loses ground. The CoinDesk daily brief that morning notes BTC under pressure from "ETF outflows, higher oil prices," with crude oil benchmarks spiking on transit disruption fears.
June 2, 2026 — Bitcoin Falls to $67,000; $1.23B Liquidation Precursor: A precursor cascade occurs as bitcoin falls to $67,000 and total liquidations reach $1.23 billion across all venues. Long traders account for $1.08 billion of the damage, with only $142.75 million in short positions liquidated. Derivatives data from this session begins flashing multi-layer warning signals: implied volatility compresses to 36 (the lowest since September), despite price declining — an unusual divergence indicating that options market makers are not pricing additional vol premium even as realized moves accelerate. Bitcoin open interest climbs to 788,600 BTC (from 759,000 the prior week), meaning new leveraged long exposure is being added even as the market falls — a classic pre-liquidation-cascade setup.
June 3, 2026 — The Main Event: $1.84B Liquidation Cascade and Rubio's Hormuz Mining Threat: The culminating event arrives in overnight Asian trading. BTC plunges to an intraday low of $65,708; ETH breaks below $1,900 to $1,874.68; SOL falls to $75.12. The aggregate liquidation total over the 24-hour period reaches $1.84 billion — the largest since the February 5 cascade — with $1.66 billion in longs destroyed. The headline catalyst: Marco Rubio publicly raises the possibility of mining the Strait of Hormuz, a threat several orders of magnitude more severe than airstrikes. Mining the Strait would constitute a blockade under international maritime law, potentially triggering oil supply disruptions affecting 20 million barrels per day, secondary Gulf state responses, and direct threat to global trade flows. Prediction markets react immediately, with the probability of sub-$55,000 bitcoin by year-end rising to 66%.

Technical Analysis
The June 3 cascade has a technical anatomy that distinguishes it from typical market corrections and reveals why the damage was so severe. The foundational issue is that the May 28–June 1 partial recovery — bitcoin bouncing from $72,978 to the $69,000–70,000 range — was accompanied by a paradoxical increase in open interest. Open interest rose from 759,000 BTC to 788,600 BTC over that window, meaning that as prices were recovering modestly, a new cohort of leveraged longs was being established at higher entry points. These were "dip buyers" layering into long positions during the bounce, expecting a resumption of the bull trend. When Rubio's Hormuz mining threat hit the tape on the evening of June 2 (Asian time), this fresh long inventory had no time to unwind gracefully: the cascade was triggered.
The exchange-level mechanics reveal how liquidity fragmentation amplified the damage. Binance, handling $748 million (41% of all liquidations), saw 89% of its closed positions come from longs — reflecting the platform's retail-dominant user base that had been systematically buying dips throughout May. Hyperliquid, a more derivatives-native venue, cleared $314 million with an even higher 94% long ratio, reflecting the platform's skew toward leveraged directional traders. Bybit logged $247 million at 93% longs. What makes this data analytically significant is the uniformity of the long-to-short ratio across all three venues — between 89% and 94% long — indicating that the market had an asymmetric directional consensus rather than a balanced two-sided book. When consensus positioning is this one-sided, liquidation cascades tend to be particularly vicious because there is insufficient short-side liquidity to absorb market-sell orders from forced long closures.
At the asset level, the damage distribution tracks the Coinglass liquidation heatmap precisely: bitcoin longs absorbed $883.66 million, ether longs $475.73 million, and SOL longs $91.18 million, with the remaining approximately $390 million spread across HYPE, DOGE, SUI, BNB, NEAR, AAVE, LINK, and the broader top-30 long book. The largest single order — a $59.67 million BTC-USDT long closed on HTX — suggests institutional-scale accounts were also caught in the cascade, not merely retail traders. This is consistent with the OKX whale data, where accounts in the top-tier size bracket registered a 0.54 long-to-short ratio — a reading CoinGlass classifies as "extremely bearish" — meaning large accounts have already shifted net short while retail remains net long. This structural imbalance (whales short, retail long) is a textbook setup for continued downside pressure.
The retail sentiment metrics compound this picture. On Binance, the retail long-short ratio stood at 2.22 at the time of the cascade — meaning for every retail trader positioned short, 2.22 were long. OKX retail showed 2.01, and Bybit 1.58. These ratios remained elevated even after the $1.84 billion wipeout, suggesting that the "buy the dip" mentality persists despite repeated punishment. The persistence of bullish retail sentiment against the backdrop of extreme institutional bearishness (0.54 whale ratio on OKX) creates continued liquidation risk: as long as retail maintains high long ratios at these price levels, any further macro catalyst — whether a Hormuz incident or a US policy surprise — can trigger another cascade with similar amplitude.
flowchart TD
    A["US-Iran Escalation\nMay 9 - June 3, 2026"] --> B["May 28: US Strikes\nHormuz Air Defenses\n$958.8M Liquidations"]
    A --> C["June 1: IRGC Retaliates\nKuwait Airbase Strike\nOil +4%"]
    B --> D["BTC Below $73K\nETH Loses $2,000\nCeasefire Premium Erased"]
    C --> D
    D --> E["June 2: Dip Buyers\nRe-enter; OI +29,600 BTC\n→ One-Sided Long Book"]
    E --> F["June 3: Rubio\nHormuz Mining Threat\n→ Macro Escalation Signal"]
    F --> G["Liquidation Cascade\n$1.84B Total\n$1.66B Longs Destroyed"]
    G --> H["Binance $748M\n89% Longs"]
    G --> I["Hyperliquid $314M\n94% Longs"]
    G --> J["Bybit $247M\n93% Longs"]
    H --> K["BTC: $883M\nETH: $475M\nSOL: $91M"]
    I --> K
    J --> K
    K --> L["BTC Below $66K\nETH Below $1,900\nPrediction: 66% chance\nsub-$55K by Year-End"]
    L --> M["BTC Correlation:\nNasdaq 0.75\nGold -0.27\n→ Safe-Haven Narrative Collapse"]
    M --> N["Capital Rotation:\nAI Equities + Gold\nvs. Crypto Outflows\n$2.97B ETF Streak"]
On-Chain & Market Data
Metric | Value | Change | Source |
|---|---|---|---|
Total 24h Liquidations (June 3) | $1.84 billion | Largest since Feb 5, 2026 | CoinGlass / CoinDesk |
Long Liquidations | $1.66 billion | 90.2% of total | CoinGlass |
Bitcoin Longs Liquidated | $883.66 million | +128% vs. May 28 event | CoinGlass |
Ethereum Longs Liquidated | $475.73 million | +93% vs. May 28 event | CoinGlass |
Solana Longs Liquidated | $91.18 million | Largest SOL liq. in 2026 | CoinGlass |
BTC Price (June 3 intraday low) | $65,708 | -12.3% weekly | CoinDesk |
ETH Price (June 3) | $1,874.68 | -11.1% weekly | CoinDesk |
SOL Price (June 3) | $75.12 | ~-9% weekly | CoinDesk |
Bitcoin Open Interest | 788,600 BTC | +3.9% vs. prior week | CoinGlass |
BTC-Nasdaq Correlation | 0.75 | vs. ~0.55 in 2025 | Kavout Research |
BTC-Gold Correlation | -0.27 | Turned negative in 2026 | Kavout Research |
Bitcoin Market Cap Rank | 13th globally | Fell from 7th in Jan 2026 | CoinDesk |
Spot BTC ETF Net Outflows (10-session) | $2.97 billion | Longest streak on record | Bitcoin Foundation |
Weekly ETF Outflows (June 2026) | $1.67 billion | Record weekly withdrawal | Bitcoin Foundation |
Retail Long-Short Ratio (Binance) | 2.22 | High bullish consensus | CoinGlass |
Whale Long-Short Ratio (OKX) | 0.54 | "Extremely Bearish" | CoinGlass |
Prediction Market: BTC < $55K by year-end | 66% | Up from ~30% on May 9 | CoinDesk |
Largest Single Liquidation | $59.67M BTC-USDT | On HTX exchange | CoinDesk |
The most analytically significant data point in the table is not the headline liquidation number but the divergence between retail and whale positioning. Retail long-short ratios across Binance (2.22), OKX (2.01), and Bybit (1.58) all indicate sustained bullish bias from smaller accounts, even after repeated punishment. Meanwhile, whale accounts on OKX are sitting at 0.54 — net short. This configuration is a structural imbalance that perpetuates waterfall dynamics: each macro shock forces liquidations among the over-extended retail long book, which in turn generates short-side profits for institutional accounts, which have little incentive to close those shorts until price reaches more attractive levels. The 66% prediction-market probability of sub-$55,000 bitcoin by year-end suggests that large capital — the kind that moves prediction markets — has internalized the bear thesis.
The ETF data provides the institutional corroboration. The $2.97 billion, 10-session outflow streak represents a deliberate and sustained reallocation decision, not panic selling. These are allocators who made deliberate decisions across multiple trading sessions to reduce crypto exposure. The weekly withdrawal rate of $1.67 billion in early June 2026 is running at a pace that would represent roughly $7 billion per month if sustained — a level that would put meaningful structural selling pressure on the BTC spot market regardless of derivatives dynamics. The combination of open interest expansion (new retail longs being added) and ETF net outflows (institutions exiting spot) creates a classic "crowded retail long, institutional exit" configuration that historically precedes multi-week downtrends.
Competitive Landscape
Bitcoin vs. Gold: The most damaging competitive dynamic for BTC in 2026 is gold's performance. Gold reached approximately $5,600 per troy ounce in early 2026 before settling near $4,486 — still representing a ~17% year-to-date gain at the time of writing. Silver surged as high as $120 per ounce. In a genuine geopolitical stress scenario — the exact environment that the "digital gold" narrative predicted would benefit bitcoin — capital has flowed decisively to physical precious metals, not digital assets. The reason is fundamental: gold's safe-haven properties derive from millennia of precedent, central bank reserve status, and zero counterparty risk. Bitcoin, whose network security depends on mining infrastructure, energy markets, and protocol governance, carries counterparty risk from a geopolitical perspective — if major mining jurisdictions (US, Russia) become adversarial, the network's hashrate distribution becomes a geopolitical variable itself.
Bitcoin vs. AI Equities (NVIDIA, Broadcom, TSMC): Capital that flowed into crypto in 2024-2025 as a "asymmetric growth bet" is now being replaced by AI semiconductor stocks, which offer superior earnings visibility, institutional research coverage, and optionality on what is now widely perceived as the dominant technological megatrend. While BTC has fallen 12.3% weekly, the MSCI All Country World Index logged a fresh all-time high. NVIDIA and peer AI plays have become the consensus institutional "asymmetric bet," occupying the conceptual space that bitcoin occupied in 2020-2021. The BTC-Nasdaq 0.75 correlation means that crypto is moving with tech but not accessing the AI premium — the worst of both worlds.
Ethereum vs. Solana as Infrastructure: Even within crypto, the competitive dynamics are shifting. The June 3 liquidation data shows ETH longs absorbing $475.73 million versus SOL longs at $91.18 million — broadly in line with market cap ratios, but notable in that SOL's $91 million longs liquidated at a $75.12 price level suggests far more concentrated retail long positioning at inflated entry points relative to SOL's fundamental trajectory. Ethereum, despite its price decline, retains superior institutional infrastructure through CME futures, BlackRock's BUIDL fund, and the greatest density of real-world asset tokenization projects. Solana's retail-heavy trading environment makes it disproportionately vulnerable to the exact liquidation cascades documented here.
Centralized Derivatives Venues vs. Decentralized (Hyperliquid): A structurally novel data point is Hyperliquid's $314 million in liquidations — 17% of the total — from a platform that did not exist at institutional scale as recently as 2024. Hyperliquid is now processing liquidation volume comparable to Bybit ($247 million), which has been a top-3 derivatives exchange for years. This suggests a rapid migration of derivatives trading activity from centralized to decentralized venues, with implications for regulatory oversight, market surveillance, and the systemic risk profile of future liquidation cascades.
Stakeholder Analysis
Leveraged Retail Traders: The most immediate losers. The persistence of 2.0+ long-short ratios on Binance, OKX, and Bybit after repeated eight-figure wipeouts suggests either behavioral anchoring to a prior bull market thesis or insufficient risk management tools on retail platforms. The $59.67 million single-order closure on HTX indicates that even accounts of institutional scale were caught in the cascade. Retail traders face a particularly acute information asymmetry: they see the same price charts as institutional accounts but lack access to the whale-level positioning data (OKX 0.54 ratio) that signals where the real money is positioned.
Institutional Allocators (ETF Holders, Family Offices): The $2.97 billion ETF outflow streak represents institutional decision-making at allocation committee level — not emotional retail selling. These allocators are revising their crypto position sizing relative to AI equities, gold, and commodities in a rising geopolitical risk environment. The key question for this cohort is whether reduced allocations represent tactical trimming or strategic exit. If the latter, the ETF AUM drawdown could persist through Q3 and become a self-reinforcing price depressant.
Mining Industry: The Strait of Hormuz dynamic has an underappreciated direct impact on Bitcoin mining economics. Energy prices are a primary mining cost driver, and any sustained disruption to Hormuz transit would elevate oil prices, raising electricity costs for miners globally (many large-scale operations in Texas, Kazakhstan, and the UAE operate on gas-pegged electricity tariffs). Higher mining costs at lower BTC prices would compress miner margins, potentially triggering forced BTC sales from miners seeking to cover operational costs — an additional structural selling pressure layer not captured in the derivatives liquidation data.
Protocol Developers (Ethereum, Solana foundations): The narrative damage from the safe-haven collapse extends beyond price to developer recruiting and ecosystem grant funding. At $1,874 per ETH and $75 per SOL, treasury valuations for protocol foundations are reduced in dollar terms, constraining hiring and ecosystem investment. More critically, the bifurcation of institutional capital into AI and traditional finance DeFi creates a competitive landscape where the strongest protocol value propositions (RWA tokenization, institutional-grade infrastructure) are increasingly necessary for differentiation — a trend that favors Ethereum's institutional ecosystem over Solana's retail trading culture.
Regulators (CFTC, SEC, International FSB): The Hyperliquid liquidation data — $314 million on a decentralized venue — will attract regulatory attention. US regulators have been expanding their oversight of offshore derivatives platforms, and a venue processing this volume of liquidations without CFTC supervision represents exactly the kind of systemic risk that the FSB's 2023 crypto recommendations identified as a priority gap. The geopolitical overlay adds urgency: if a Hormuz-driven energy shock triggers a broader financial markets downturn, crypto derivatives cascades occurring on unregulated venues could become a headline systemic risk issue.
Risk Assessment
Strait of Hormuz Mining / Blockade Materialization — Severity: Critical / Probability: Moderate (25-35%) — If Rubio's threat progresses from rhetoric to action, the resulting oil supply shock would trigger coordinated risk-off across all asset classes. Unlike the airstrikes (which were priced as temporary), a mining operation would constitute an indefinite supply disruption, elevating oil to potentially $150+/barrel. The crypto impact would be an order of magnitude larger than the June 3 cascade, with the realistic scenario being BTC testing $50,000 or lower and the prediction market's 66% sub-$55,000 probability becoming nearly certain. Mines are also difficult to remove quickly, meaning the duration of the disruption would be indeterminate — a key risk amplifier.
Retail Long Book Capitulation Cascade — Severity: High / Probability: High (60-70%) — With Binance retail long-short ratios still at 2.22 post-cascade, the structural overhang of retail long exposure has not been cleared. Each additional macro shock — whether Hormuz, broader Middle East escalation, or a US macro data miss — will trigger another forced-liquidation wave from this persistent long inventory. The OI expansion to 788,600 BTC despite falling prices confirms that fresh longs are being added even now, replenishing the inventory available for future cascades. This is an active, ongoing risk rather than a historic artifact.
ETF Structural Outflow Acceleration — Severity: High / Probability: Moderate-High (50-60%) — The $2.97 billion, 10-session outflow streak may be the early phase of a longer institutional reallocation cycle rather than a temporary blip. If Q2 2026 earnings season confirms that AI semiconductor stocks are delivering earnings that justify their valuations, allocators who had positioned crypto as a "tech-adjacent growth bet" will face pressure to rotate those positions formally. A sustained $1.5–2B/month ETF outflow pace would represent a $15–20 billion annual spot market headwind — larger than most prior bear-market selling cycles.
BTC Correlation Lock-In Preventing Recovery — Severity: Moderate / Probability: High (65%) — The 0.75 correlation with Nasdaq and -0.27 correlation with gold creates a mathematical trap: for bitcoin to recover, it needs either (a) a tech bull run that lifts all correlated assets, which would only return BTC to its role as a weaker tech proxy, or (b) a narrative reset that restores safe-haven appeal, which requires sustained periods of BTC outperforming gold during stress events. The latter has not occurred during any 2026 crisis event. Without a correlation break, bitcoin's recovery path runs through Nasdaq performance rather than through any crypto-specific catalyst — which limits upside and does not solve the fundamental competitive positioning problem against AI equities.

Investment & Strategic Implications
For hedge funds and macro allocators, the June 3 data formalizes a framework shift that the May 28 event began. The BTC-Nasdaq 0.75 / BTC-Gold -0.27 correlation regime makes bitcoin functionally redundant in a portfolio that already holds tech equities and seeks geopolitical hedging through gold and commodities. The rational institutional response — already visible in the ETF outflow data — is to reduce BTC allocation as a percentage of risk-asset exposure while gold and AI equities absorb the same risk budget at superior return profiles. For allocators who retain crypto exposure for idiosyncratic reasons (regulatory optionality, digital asset infrastructure thesis, on-chain business models), the key rotation is from leveraged directional long positions to low-leverage, utility-generating strategies: staking yields on ETH, institutional-grade DeFi positions on tokenized treasuries, and basis trades between spot ETF prices and futures curves. The June 3 cascade illustrates viscerally that naked leveraged crypto longs in a geopolitical stress environment carry catastrophic drawdown risk.
For protocol builders and venture-backed crypto projects, the bifurcation between "institutional infrastructure" and "retail speculation" assets is becoming the defining competitive divide. Ethereum's institutional DeFi ecosystem — BUIDL, tokenized treasuries, CME futures products — positions it as the winning side of that divide in a sustained capital-rotation environment. Protocols seeking institutional traction in the current environment need to frame value propositions explicitly around financial infrastructure use cases (settlement, tokenization, programmable compliance) rather than retail trading or NFT-adjacent narratives. Solana's retail trading culture and high-throughput DEX dominance serve it well in bull cycles but create disproportionate liquidation exposure — as the June 3 data shows — in geopolitically stressed bear environments. Builders on Solana have a strategic incentive to diversify use cases toward institutional applications to reduce the volatility of ecosystem activity.
For on-chain market participants specifically, the whale vs. retail positioning divergence (0.54 vs. 2.22 long-short ratios) represents a potentially tradeable structural signal. The last two times this exact configuration appeared in CoinGlass data — overlapping long retail consensus with extreme institutional short positioning — were the February 5, 2026 cascade (also the largest liquidation event BTC had seen at that time) and the May 2025 correction. In both cases, retail long ratios above 2.0 coincided with at least one additional 10-15% drawdown before the long-short imbalance normalized. Short-side exposure on BTC derivatives with disciplined sizing and defined exit levels represents the trade most consistent with the current positioning data, though the inherent unpredictability of geopolitical escalation timelines requires careful volatility management.
Outlook: 30 / 180 / 365 Days
30 days: The critical variable is whether Rubio's Hormuz mining threat translates into military action or diplomatic de-escalation. If the current military-pressure-plus-compressed-diplomatic-timeline approach yields a framework agreement (as Rubio has suggested could happen within days), BTC could see a relief rally to $72,000–75,000, supported by short covering from the extreme institutional short positioning. However, absent a credible ceasefire, the retail long overhang (Binance 2.22 ratio), persistent ETF outflows, and open interest expansion mean that BTC is more likely to test $60,000–62,000 support. A falsifiable prediction: if no Hormuz framework agreement emerges by July 1, BTC will trade below $62,000 at least once.
180 days: The medium-term thesis hinges on whether the BTC-Nasdaq correlation decouples. This requires either (a) a BTC-specific positive catalyst (new sovereign nation adoption, breakthrough regulatory clarity on US crypto legislation) that is independent of AI equity performance, or (b) a tech equity correction that fails to drag BTC down proportionally — which would require institutional allocators to treat crypto as genuinely uncorrelated at the margin. Neither condition appears likely in the current environment. The base case for the 180-day horizon is BTC trading in a $55,000–72,000 range with continued ETF outflow pressure, Ethereum trading in a $1,600–2,200 range as its institutional DeFi narrative provides partial support, and SOL underperforming both due to its retail concentration. The probability-weighted expectation from prediction markets (66% sub-$55K) represents a more bearish distribution than this range implies.
365 days: The one-year structural question is whether the Hormuz crisis becomes the catalyst that either (a) permanently breaks the safe-haven narrative, cementing bitcoin as a high-beta tech proxy for institutional classification purposes, or (b) paradoxically restores it, if a sustained energy supply shock drives fiat devaluation concerns that reignite interest in scarce-supply assets. History suggests that deflationary crises (2008, 2020) have been more bullish for bitcoin than inflationary supply shocks (2022). An oil-price-driven inflationary scenario of the type Hormuz mining would generate more closely resembles the 2022 environment, which coincided with crypto's worst annual performance. The long-term structural implication — independent of Hormuz resolution — is that bitcoin's failure to act as a safe haven in the 2026 crisis events will require several years of narrative rehabilitation before institutional allocators treat it as a portfolio hedge again, fundamentally capping upside multiples relative to prior cycles.
References
Bullish crypto bets lose $1.6 billion as ETH, SOL, DOGE drop 9% — CoinDesk, June 3, 2026
Bitcoin slips to 13th largest asset as AI semiconductor booms accelerate — CoinDesk, May 27, 2026
Bitcoin ETF Outflows June 2026: $1.67B Weekly — Bitcoin Foundation
Safe-Haven Narrative Collapse: Why Bitcoin Fails the 2026 Trade War Test — Editorialge
US military strikes Iranian drone sites and air defenses, crypto markets shed $80B — Crypto Briefing
Marco Rubio says Iran deal still possible within days despite US strikes — Crypto Briefing
Is Bitcoin Truly a Safe-Haven Amidst Geopolitical Storms — Kavout Market Lens
BTC, ETH Prices: Impact of 2022–2026 Geopolitical Conflicts — Crypto.com International