Digital Gold Stress Test: How Bitcoin Outperformed Every Traditional Safe Haven Through the US–Iran War of 2026
Bitcoin's safe-haven thesis survived its most rigorous real-world test, outperforming gold by 36% and absorbing $2.44B in April ETF inflows even as the first US–Iran armed conflict in decades rocked global markets.
Executive Summary
Bitcoin declined 47% from its October 2025 all-time high of $126,000 to a 2026 nadir of $65,834 on April 3, yet subsequently outperformed gold, US equities, and Asian benchmarks by wide margins once short-term panic subsided
BlackRock's IBIT alone captured $1.71 billion of $2.44 billion in total spot Bitcoin ETF inflows during April 2026 — the strongest monthly figure since October 2025 — signaling that institutional long-term conviction survived the geopolitical stress test
The US government's "Operation Economic Fury" froze $344 million in Tether USDT linked to Iranian accounts, while OFAC updated the Central Bank of Iran designation, transforming crypto markets from geopolitical sideshow into active sanctions battlefield
The traditional safe-haven rotation reversed: gold ETFs shed nearly $11 billion in outflows even as gold initially surged, while Bitcoin's BTC/gold ratio registered a 36% relative outperformance since February 28, 2026 — rewriting the conventional macro playbook
CME Bitcoin futures open interest hit a record $45 billion in April 2026 with 24/7 institutional trading slated for May 29 launch, cementing Bitcoin's structural transition from speculative asset to macro hedging instrument in the institutional toolkit
Background & Market Context
The US–Iran military confrontation that began with Iranian strikes on US bases across the Middle East on February 28, 2026, arrived against an already-stressed crypto market. Bitcoin had traced a brutal 47% correction from its October 2025 high of $126,000, driven largely by Federal Reserve hawkishness and deteriorating risk appetite through Q4 2025. The war's outbreak therefore collided with a market already in technical bear territory, creating a rare natural experiment: would Bitcoin behave as a risk-off safe haven — akin to gold — or would it correlate tightly with equities as a high-beta risk asset?
The macro backdrop amplified every market signal. Oil prices surged above $106 per barrel by mid-April 2026, stoking inflation expectations and all but eliminating near-term Federal Reserve rate-cut probabilities. A higher-for-longer rate environment traditionally pressures Bitcoin by reducing the appeal of non-yielding assets and tightening global dollar liquidity — the same liquidity cycle that had historically powered the 2020–2021 and 2023–2025 crypto bull runs. When Brent crude breached $85/barrel as a sustained level, the oil-BTC correlation — more powerful than the geopolitical headlines themselves, per multiple analysts — became the dominant market signal.
Simultaneously, the conflict exposed crypto markets to a previously theoretical risk: active sanctions deployment within blockchain networks. Iran's estimated $7.78 billion in crypto-related activity in 2025 (Chainalysis data), with IRGC-linked wallets accounting for more than $3 billion, had quietly made stablecoins — particularly Tether's USDT on the Tron network — a strategic financial layer for sanctioned actors. As the military conflict intensified, Washington used this infrastructure as a coercive tool, deploying blockchain's transparency against its own users in an unprecedented demonstration of financial warfare at the protocol layer.
What emerged over 10 weeks of conflict was a market narrative in rapid flux. Bitcoin initially behaved like the risk asset its critics claim it to be, absorbing $3.8 billion in ETF outflows during February 2026 alone. But as institutional actors processed the longer-duration implications — war financing, monetary expansion, dollar debasement, and the breakdown of existing financial rails — a structural rotation began. By mid-April, Bitcoin's 7–17% gain from conflict onset vastly outpaced gold's trajectory, and BlackRock's Larry Fink was publicly describing Bitcoin as "an asset of fear" that investors turn to when worried about currency debasement and geopolitical instability. The narrative had survived contact with reality; the question was whether the data would sustain it.
Key Developments
February 28, 2026 — The Outbreak: Iran launches coordinated strikes on US military installations across the Middle East, triggering immediate market dislocations. Bitcoin opens the week at approximately $65,492. Weekend liquidations across crypto derivatives markets total $300 million, with Bitcoin touching $63,000 intraday — a cascading waterfall through key support levels. The DXY dollar index spikes to January 2026 highs as capital flees to perceived dollar safety, compounding Bitcoin's drawdown. Oil surges past $90/barrel within 48 hours.
Early March 2026 — The House Vote and Legislative Deadlock: A razor-thin 213–214 House vote fails to pass a resolution curbing the executive war powers being deployed against Iran. Markets interpret the legislative deadlock as a green light for extended military operations. Bitcoin, functioning as a 24/7 real-time policy barometer, immediately prices in the extended conflict scenario, sliding toward $63,000–$65,000 range support. Analysis at the time notes Bitcoin is effectively serving as an after-hours substitute for traditional risk gauges — CME futures and equity markets are closed during weekend escalations, but Bitcoin never sleeps.
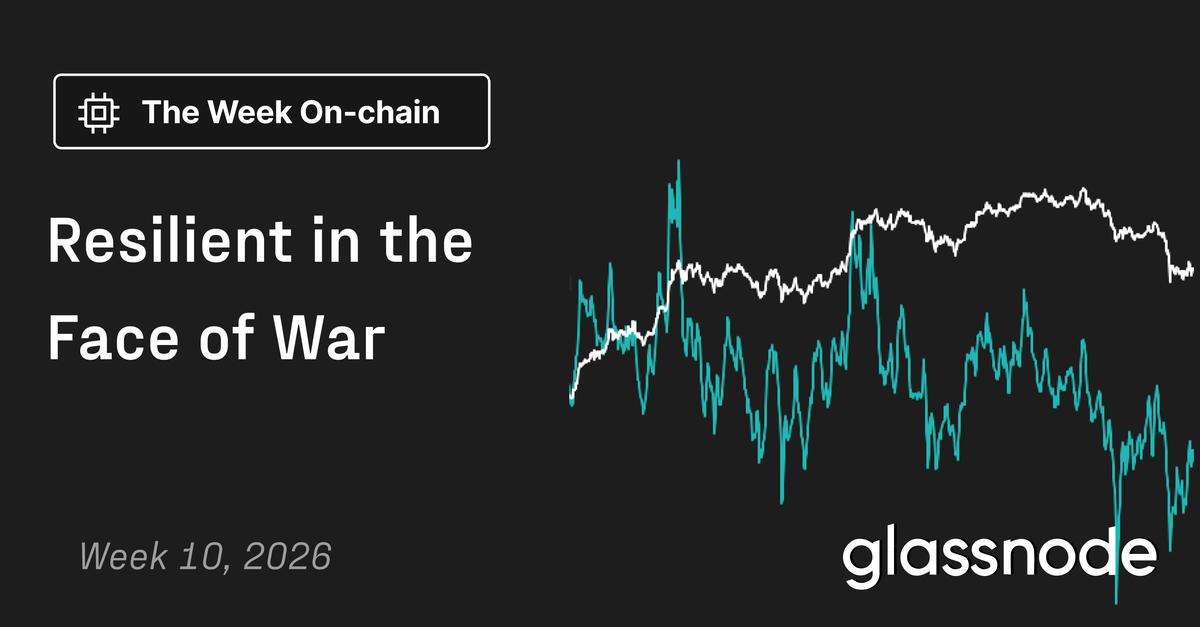
March 5–14, 2026 — Capitulation and First Stabilization: Bitcoin establishes a trading range of $62,800–$72,600 that persists for over a month. The Glassnode "Resilient in the Face of War" report (Week 10, 2026) documents the emerging stabilization, noting that the 7-day ETF flow average has "returned to positive territory" — the "most significant demand impulse since the correction began." Short-Term Holder SOPR falls below 1.0 (reading: 0.985), confirming recent buyers are realizing losses — a textbook bear market signal. Perpetual futures funding turns negative, indicating growing short positioning and the latent potential for a short squeeze.
March 16, 2026 — CoinShares Inflow Surge: The week ending March 16 sees $1.06 billion in inflows to digital asset investment products — $793 million of it (75%) flowing into Bitcoin specifically. This is the first unambiguous institutional vote of confidence since the conflict began. CoinShares' James Butterfill characterizes the rotation as reflecting "accumulation by investors who view the current price as a discount relative to the long-term monetary debasement thesis." Gold simultaneously records outflows, reversing its initial safe-haven surge.
April 3, 2026 — Cycle Low: Bitcoin touches $65,834, the definitive 2026 low, following escalating executive rhetoric around potential strike expansion. Options positioning at $74,000–$75,000 strikes creates a significant gamma wall that capping near-term upside. At this point, accumulated Bitcoin ETF outflows year-to-date reach $4.5 billion, compared to $16 billion flowing into gold ETFs — the largest divergence between the two assets in the ETF era.
April 11, 2026 — Diplomatic Failure: US–Iran negotiation rounds collapse without a ceasefire framework. Bitcoin, Ethereum, and XRP all sell off. Oil stabilizes above $100/barrel. Market pricing reflects that the "quick resolution" scenario (2–4 week timeline outlined by Trump administration) is off the table, and the "prolonged conflict" scenario (2–6 months, oil at $80–100/barrel, BTC target $55,000–$60,000) is now base case.
April 23–24, 2026 — The Tether Freeze and Operation Economic Fury: The US Treasury Department, in coordination with Tether, executes "Operation Economic Fury" — freezing $344 million in USDT tokens on the Tron network linked to the Central Bank of Iran and IRGC-affiliated wallets. OFAC simultaneously updates the Central Bank of Iran designation. The freeze is the largest state-directed crypto asset seizure since the DOJ's 2022 Bitfinex recovery, and demonstrates that US sanctions reach extends into supposedly censorship-resistant stablecoin networks. Reports surface that IRGC actors had been demanding Strait of Hormuz transit toll payments denominated in stablecoins, having been cut off from SWIFT.
Late April 2026 — IBIT's Institutional Inflection: BlackRock's IBIT Bitcoin ETF records $3 billion in net inflows, with all rolling time periods turning positive for the first time since the conflict began. April 2026 total spot Bitcoin ETF inflows hit $2.44 billion — the strongest monthly figure since October 2025 — with IBIT commanding a 70% share at $1.71 billion. Larry Fink's "asset of fear" characterization resonates widely among institutional allocators, reframing Bitcoin's geopolitical performance as thesis confirmation rather than deviation.
Technical Analysis
Bitcoin's price behavior during the US–Iran conflict reveals a four-phase market structure that contradicts the simplistic "risk-on / risk-off" binary that most macro analysts apply. Understanding each phase is essential for deploying capital in the next geopolitical shock cycle.
Phase 1 — Panic Flush (Days 1–14): The initial response was unambiguously risk-asset-like. Bitcoin declined approximately 7% in the first two weeks while gold initially spiked. This phase reflects the behavior of institutional participants who carry Bitcoin alongside equities in multi-asset portfolios: when margin calls hit, the most liquid 24/7 asset — Bitcoin — is sold first. This "liquidation layer" phenomenon, well-documented after the COVID crash of March 2020, is not a refutation of the safe-haven thesis but a structural artifact of Bitcoin's superior market liquidity relative to gold ETFs in a margin-call environment. Critically, $300 million in leveraged positions were liquidated in the opening weekend, cleansing the market of speculative excess.
Phase 2 — Distribution and Base Building (Days 14–45): The $62,800–$72,600 range that held for over a month was not a period of weakness but of accumulation and distribution. Glassnode's on-chain analysis reveals the formation of a dense supply cluster between $59,000 and $72,000, built predominantly across February and March 2026. The Percent of Supply in Profit recovered toward 60% — historically associated with first-bounce exhaustion at cycle bottoms. STH-SOPR remaining below 1.0 confirmed that recent buyers were underwater, eliminating their sell pressure from market structure. Realized Price sitting at $54,400 (average acquisition cost of all circulating supply) implied that the overwhelming majority of long-term holders remained deeply in profit and had no structural incentive to sell.
Phase 3 — Divergence Trade (Days 45–70): As gold's initial safe-haven bid faded — burdened by margin calls, dollar strength, and the specific mechanics of gold futures positioning — Bitcoin's BTC/gold ratio began its structural divergence. The 36% outperformance was not driven by Bitcoin gaining 36% in absolute terms, but by the compound effect of gold declining approximately 18% from its war-onset price while Bitcoin recovered and advanced. JPMorgan's observation that precious metals saw "significant outflows and position liquidations" while Bitcoin attracted inflows points to a genuine rotation of safe-haven capital across asset classes — not merely relative performance from divergent starting conditions.
Phase 4 — Institutional Re-engagement (Days 70+): The return of whale inflows for two consecutive weeks in May 2026 — the first sustained whale accumulation since autumn 2025 — combined with CME open interest reaching a record $45 billion, confirms that sophisticated institutional capital has re-engaged at current levels. The True Market Mean of $78,400 (the cost basis of actively transacted coins) serves as the key structural target: a sustained close above this level would confirm full market recovery and likely trigger additional institutional inflow cascades.
flowchart TD
    A["🔴 Feb 28, 2026\nIran Strikes US Bases\nBTC: ~$65,492"] --> B["📉 Phase 1: Panic Flush\n$300M Liquidations\nBTC → $63,000 Low\nDays 1–14"]
    B --> C["📊 Phase 2: Base Building\nRange: $62.8K–$72.6K\nAccumulation Cluster Forms\nSTH-SOPR < 1.0\nDays 14–45"]
    C --> D["💥 April 3: Cycle Low\nBTC: $65,834\nYTD ETF Outflows: $4.5B\nGold ETF Inflows: $16B"]
    D --> E["📈 Phase 3: Divergence Trade\nBTC +17% from Onset\nGold –18% from Onset\nBTC/Gold Ratio: +36%\nDays 45–70"]
    E --> F["🏛️ Phase 4: Institutional Re-entry\nIBIT: $1.71B April Inflows\nCME OI: $45B Record\nWhale Inflows Return\nDays 70+"]

    G["🏦 BlackRock IBIT\nLarry Fink: 'Asset of Fear'\n70% ETF Market Share"] --> F
    H["⚖️ Operation Economic Fury\nTether Freezes $344M USDT\nOFAC Updates Iran Designation"] --> I["🔒 Sanctions Layer Active\nIRGC Stablecoin Activity Disrupted\nChainalysis: $7.78B Iran Crypto 2025"]
    I --> E

    J["📉 Fed: No Rate Cuts\nOil > $106/bbl\nDXY Strength"] --> B
    J --> C

    K["🐳 Whale Inflows Return\nFirst Since Autumn 2025\nMay 2026"] --> F

    style A fill:#ff4444,color:#fff
    style D fill:#ff6b6b,color:#fff
    style F fill:#00a651,color:#fff
    style H fill:#ffa500,color:#fff
On-Chain & Market Data
Metric | Value | Change | Source |
|---|---|---|---|
Bitcoin Price (Apr 3 Low) | $65,834 | –47.8% from $126K ATH | MEXC / CoinDesk |
BTC/Gold Ratio Outperformance | +36% | Since Feb 28, 2026 | CoinShares / JPMorgan |
IBIT April 2026 Net Inflows | $1.71B | 70% of all spot BTC ETF flows | CryptoFeed / FXLeaders |
Total Spot BTC ETF Inflows (April) | $2.44B | Best month since Oct 2025 | CoinShares |
BTC ETF Outflows (Feb 2026) | –$3.8B | Worst month since Jan 2024 launch | Multiple |
Gold ETF Inflows (Q1 2026) | +$16B | vs. $4.5B in BTC ETF outflows YTD | CoinShares / JPMorgan |
CME Bitcoin Futures Open Interest | $45B (record) | +59% from Oct 2025 $28.3B | CoinReporter |
CME Avg Daily Volume (2026) | 407,200 contracts | +46% year-over-year | CME Group |
Tether USDT Frozen (Iran) | $344M | Single largest state-crypto seizure post-2022 | CoinDesk / CNN |
Glassnode Realized Price | $54,400 | Avg acquisition cost, all supply | Glassnode Week 10 |
Glassnode True Market Mean | $78,400 | Cost basis of active coins; key recovery target | Glassnode Week 10 |
% Supply in Profit | ~60% | Recovery from sub-50% lows | Glassnode |
STH-SOPR (7D EMA) | 0.985 | Below 1.0 since Oct 2025 (bear regime) | Glassnode |
Iran Crypto Activity (2025) | $7.78B | Per Chainalysis blockchain analysis | Chainalysis |
The most revealing aspect of the data composite is the structural divergence between short-term ETF flows and long-term on-chain metrics. The $4.5 billion in YTD Bitcoin ETF outflows through February reflects the behavior of tactical allocators — hedge funds, family offices, and retail participants using ETFs as short-duration trading vehicles. These participants sold into the uncertainty of conflict escalation, mirroring their behavior in traditional risk assets. Yet simultaneously, on-chain whale accumulation remained disciplined: Glassnode's long-term holder cohort never wavered, and the dense supply cluster between $59,000 and $72,000 represents months of patient accumulation at prices that long-term holders regarded as structurally cheap relative to the monetary debasement thesis.
The Tether data adds a dimension entirely absent from prior geopolitical market analyses. The $344 million freeze is not just a compliance enforcement action — it is evidence that Bitcoin and stablecoins have become active theater in kinetic conflicts, not just passive stores of value. The IRGC's pivot to stablecoin-denominated Strait of Hormuz toll demands represents the strategic use of crypto rails to circumvent SWIFT exclusion. Washington's countermove through Tether suggests that the stablecoin layer — not Bitcoin itself — is the primary financial warfare battleground, which paradoxically strengthens Bitcoin's censorship-resistance narrative and differentiates it from stablecoins in the risk hierarchy.

Competitive Landscape
Bitcoin vs. Gold — The 36% BTC/gold ratio outperformance is the headline, but the structural story is more nuanced. Gold's initial surge on February 28 was conventional — the metal's four millennia of safe-haven conditioning triggered automatic flows. But gold's subsequent -18% decline from war-onset prices exposes a critical structural weakness: gold ETF mechanics (settlement, counterparty exposure, rehypothecation chains) create fragility under sustained stress precisely when gold is supposed to perform. Bitcoin, despite its initial liquidation flush, recovered and advanced without counterparty risk, settlement friction, or the physical logistics that constrain gold's utility in a rapidly escalating conflict scenario. Gold's advantage remains in deep commodity futures markets and central bank reserve allocations — domains where Bitcoin does not yet compete.
Bitcoin vs. US Treasuries — The traditional flight-to-quality trade — selling risk assets to buy 10-year Treasuries — faced headwinds from an unusual constellation: the conflict is being financed by the US government (implying increased Treasury supply), oil-driven inflation threatens real returns, and political dysfunction (the 213–214 House vote) raised questions about fiscal credibility. Bitcoin's 21-million hard cap functions as the antithesis of war-finance treasury issuance, and institutional allocators appear to have processed this framing: BlackRock's CEO explicitly citing "currency debasement fears" as the driver of IBIT inflows is not coincidental language.
Bitcoin vs. Ethereum and Altcoins — Ethereum and Ripple fared worse than Bitcoin during every escalation phase, confirming that Bitcoin's monetary properties — not "crypto" as a sector — drove the relative safe-haven narrative. Ethereum's correlation with risk assets was tighter throughout, and its fee revenue volatility during peak liquidation events demonstrated ecosystem fragility. Bitcoin's dominance in ETF flows ($793 million of $1.06 billion in the March 16 week alone, a 75% share) reflects institutional preference for the narrowest, most liquid expression of crypto exposure during uncertainty.
Bitcoin vs. Tether/USDT — The Tether freeze event creates a categorical divergence within the crypto ecosystem. USDT, while offering dollar stability, now carries explicit US government intervention risk. The $344 million freeze is a proof of concept for weaponized stablecoin infrastructure: if Treasury can instruct Tether to freeze Iranian USDT on Tron, the same mechanism applies to any jurisdiction that falls into sanctions crosshairs. Bitcoin, lacking any centralized freeze authority, occupies a structurally distinct position in the risk hierarchy — a fact not lost on sovereignty-conscious allocators in non-Western markets. Bitcoin's value proposition specifically strengthened relative to stablecoins as the enforcement action played out.
Stakeholder Analysis
Institutional Investors (Long-Duration): The Q1 2026 cohort — pension funds, sovereign wealth funds, and endowments entering through ETF structures — demonstrated the behavior Bitcoin bulls had long argued for: accumulation during drawdowns rather than panic selling. IBIT's $8 billion in Q1 net inflows even as Bitcoin prices fell ~25% is the strongest empirical evidence yet that a cohort of investors has adopted Bitcoin as a strategic portfolio allocation with 3–5 year time horizons rather than a tactical trade. This cohort is the structural bid that prevented the 60–70% drawdown that historical bear cycle analysis would have suggested.
Tactical Traders and Retail Participants: February's $3.8 billion in ETF outflows originated primarily from this cohort — participants using Bitcoin ETFs as momentum vehicles or geopolitical event trades. Their exit in February both created the dislocated entry point that long-duration investors exploited and validated the ETF structure's function as a proper market mechanism (providing liquidity both to buyers and sellers in stress scenarios, unlike some closed-end fund structures).
Iranian State Actors: Iran's documented $7.78 billion in 2025 crypto activity, with IRGC wallets accounting for more than $3 billion, represents the first documented use of crypto at nation-state scale for sanctions evasion in an active conflict. The IRGC's stablecoin toll demands at the Strait of Hormuz are an extraordinary development — demonstrating that crypto infrastructure has become a genuine alternative financial system for parties excluded from SWIFT. The Tether freeze partially disrupts this capability but also demonstrates adaptability on Iran's part: the very fact that the freeze was on Tron USDT (not Bitcoin) suggests Iran's actors have already diversified their crypto toolkit.
Crypto Infrastructure Providers (Tether, Binance): Tether's cooperation with US sanctions enforcement through the $344 million freeze is simultaneously a demonstration of compliance capability and a reputational signal to sovereignty-conscious users that USDT is not neutral infrastructure. Binance faces compounded pressure: Treasury demands for enhanced Iran compliance controls, combined with the revelation of $1 billion in Iran-linked transfers highlighted in congressional oversight, create regulatory exposure that threatens BNB token price and platform business model. Coinbase, operating exclusively within US regulatory frameworks, has benefited from the reputational contrast — its ETF custody revenues and institutional services revenue accelerated as institutional capital concentrated in US-regulated vehicles.
US Regulators and Treasury: The "Operation Economic Fury" sanctions action transforms Treasury's relationship with crypto infrastructure from adversarial/regulatory to collaborative/operational. OFAC's ability to coordinate with Tether for near-instant large-scale freezes creates a new financial warfare toolkit that Treasury will seek to preserve and expand. This implies continued pressure on stablecoin issuers to maintain robust OFAC compliance — and may accelerate the push for a US dollar CBDC that provides even more granular sanctions control.
Risk Assessment
Conflict Escalation to Regional War — A US military operation expanding beyond Iran's nuclear infrastructure to include IRGC command-and-control or Iranian energy infrastructure would trigger a Brent crude spike above $120/barrel sustained — the scenario MEXC identified as the "deeper correction" trigger for Bitcoin toward and potentially below the $55,000–$60,000 range. Oil above $120 eliminates any Fed pivot possibility in 2026 and creates the "stagflation" macro environment most hostile to risk assets of all kinds. Severity: Extreme. Probability: 20–25% given current ceasefire negotiation trajectory.
Tether/Stablecoin Regulatory Cascade — If the $344 million USDT freeze creates a precedent that other US-aligned jurisdictions adopt (UK, EU, Japan), the stablecoin ecosystem faces an existential compliance crisis. Mass redemptions from USDT into Bitcoin (the natural censorship-resistant alternative) could spike Bitcoin in the short term, but a broader collapse in stablecoin confidence would reduce the DeFi liquidity that supports crypto market structure generally. A disorderly stablecoin unwinding could hit Bitcoin's on-chain settlement infrastructure even as it benefits Bitcoin's monetary narrative. Severity: High. Probability: 30% over 12 months.
ETF Institutional Redemption Wave — If IBIT's $8 billion in Q1 inflows represents front-running of Treasury/endowment Bitcoin allocation guidelines that subsequently face political or regulatory reversal — particularly in a conflict environment where politicians associate Bitcoin with Iranian sanctions evasion — a rapid institutional exit could overwhelm spot market absorption capacity. The January 2024 ETF launch established Bitcoin as a mainstream institutional instrument; a forced unwind under political pressure would be structurally different from tactical selling. Severity: High. Probability: 15% in 12 months.
CME 24/7 Trading Structural Risks — CME's launch of 24/7 cryptocurrency futures trading on May 29, 2026 fundamentally changes Bitcoin's market microstructure. While it eliminates the weekend gap risk that punished investors during the initial February 28 strike, it also means institutional hedging activity will influence Bitcoin pricing continuously — potentially increasing correlations with traditional macro assets and eroding the "24/7 alternative market" premium that contributed to Phase 3 outperformance. If CME's institutional flows dominate price discovery, Bitcoin may converge toward equity-correlated behavior precisely at the moment the safe-haven narrative is gaining traction. Severity: Moderate. Probability: 50–60% (structural, not tail risk).

Investment & Strategic Implications
For macro-oriented hedge funds and asset allocators, the conflict period provides the clearest evidence yet that Bitcoin merits treatment as a distinct asset class within the safe-haven/alternative currency allocation bucket — not as crypto-sector exposure alongside Ethereum and altcoins. The 36% BTC/gold relative outperformance, combined with gold ETF outflows exceeding $11 billion versus Bitcoin's return to net inflows, suggests a structural rotation is underway among long-duration institutional allocators. The optimal positioning framework appears to be: hold Bitcoin as a 3–5% portfolio allocation specifically sized to monetize the "debasement trade" thesis, with gold retained as the shorter-duration conflict hedge for the initial panic phase (when Bitcoin's liquidation dynamics create temporary underperformance), then rolling proceeds from gold into Bitcoin as the panic-flush phase exhausts itself — historically within 14–21 days of initial escalation.
For crypto-native funds and DeFi treasuries, the Tether sanctions action demands immediate protocol-level reassessment. Any treasury strategy denominated in USDT faces non-trivial freeze risk in a world where "Operation Economic Fury" has established the precedent for coordinated government-stablecoin enforcement actions. Migration of treasury reserves from USDT to either Bitcoin (for those comfortable with price volatility) or decentralized stablecoins (for those requiring dollar denomination) is not a theoretical concern — it is an operational necessity. Additionally, the IRGC stablecoin toll demand episode is a harbinger: as more state actors face SWIFT exclusion, crypto networks will be conscripted as alternative financial rails, drawing regulatory scrutiny and sanctions exposure to the infrastructure providers in those networks.
For Bitcoin protocol builders, layer-2 developers, and institutional service providers like Coinbase and Fidelity, the conflict period validates the core infrastructure investment thesis. Coinbase's position as the dominant US-regulated Bitcoin custodian — benefiting from both IBIT's ETF custody mandate and the reputational contrast with Binance's Iran exposure — represents a compounding competitive advantage. CME's 24/7 futures launch on May 29 creates new hedging infrastructure that will enable more sophisticated institutional Bitcoin strategies, particularly for funds that previously avoided Bitcoin due to the inability to hedge over weekends. These infrastructure developments collectively reduce the friction between traditional institutional capital allocation and Bitcoin exposure, suggesting the structural inflow trend is secular rather than cyclical.
Outlook: 30 / 180 / 365 Days
30 days: Bitcoin tests the $78,400 True Market Mean (Glassnode's cost basis for actively transacted coins) as the key near-term target. A sustained close above this level by June 9, 2026 would confirm Phase 4 institutional re-engagement is self-sustaining and trigger additional programmatic inflows from quant strategies tracking the STH-SOPR crossover above 1.0. Falsifiable negative signal: oil breaking and sustaining above $110/barrel restores the rate-cut-elimination narrative that drove the April 3 low, targeting $63,000 retest.
180 days: If the conflict transitions to a frozen conflict or negotiated ceasefire framework by Q3 2026 — the base case given Trump's stated 4–5 week military campaign timeline extended by diplomatic failure — Bitcoin re-engages with its structural bull market narrative: the post-halving supply reduction cycle (April 2024 halving) historically produces peak price pressure at 12–18 months post-halving, placing the structural target window at October–December 2026. Combined with CME's 24/7 launch enabling continuous institutional hedging and the precedent of $2.44 billion in monthly ETF inflows during active conflict, a recovery above $90,000 by Q4 2026 is the central scenario, conditioned on oil retreating below $85/barrel and at least one Federal Reserve rate cut materializing.
365 days: The US–Iran conflict will be remembered as the geopolitical event that permanently repositioned Bitcoin in the institutional asset allocation taxonomy. The combination of (1) documented 36% outperformance versus gold, (2) nation-state-scale adversarial use of stablecoins demonstrating the value of Bitcoin's censorship resistance, (3) CME achieving record open interest while launching 24/7 trading, and (4) BlackRock's CEO publicly endorsing Bitcoin as a geopolitical hedge asset — these four co-occurring developments in a single quarter constitute a phase transition in institutional Bitcoin legitimacy. By May 2027, if historical cycle dynamics hold and macro conditions normalize, Bitcoin's safe-haven narrative will be institutionally embedded in portfolio construction frameworks in ways that were theoretical before the Iran conflict provided real-world stress-test data. Price target: $115,000–$130,000 by May 2027, representing recovery toward and beyond the October 2025 all-time high — or 65–100% from current levels — conditioned on no escalation to sustained $120+ oil and at least partial monetary policy normalization.
References
Bitcoin war-linked selloff keeps shrinking — CoinDesk (March 14, 2026)
Bitcoin could see downside as Iran attacks US bases — CoinDesk (Feb 28, 2026)
Bitcoin, Ethereum, Ripple fall as US-Iran talks fail — CoinDesk (Apr 11, 2026)
Tether's $344M USDT freeze linked to "Economic Fury" — CoinDesk (Apr 24, 2026)
Glassnode Week-on-Chain #10: Resilient in the Face of War (2026)
Glassnode Week-on-Chain #11: Supply Cleared, Conviction Pending (2026)
Bitcoin outperforms gold by 36% since Iran war began — crypto.news
Bitcoin or Gold? Wealth Preservation During 2026 US-Iran Conflict — ChainUp
IBIT hits $3B inflows, all periods turn green — FX Leaders (Apr 23, 2026)
BlackRock IBIT captures $1.7B in April inflows — CryptoBriefing
CME Bitcoin futures OI hits record $45B amid institutional hedging — CoinReporter (Apr 2026)
US Treasury tightens pressure on Binance amid Iran crypto probe (May 8, 2026)
OFAC updates Central Bank of Iran designation — Chainalysis (Apr 2026)
US freezes $344M in crypto linked to Iran — CNN (Apr 24, 2026)
Gold vs. Bitcoin: Which safe haven is actually delivering? — Investing.com